Despite children and young people in care making up just over 1% of the overall government school population, these students consistently register higher absence rates, significantly lower NAPLAN participation rates, and are more likely to have a learning disability than the overall government school population.
In the latest of our annual education reports, we delved into the data for 2018-2019 to analyse the numbers of children and young people in care who attend government schools, looking at their attendance as well as their performance in literacy and numeracy, as tested by NAPLAN. (It is important to note this data is not currently available for the children and young people in care who attend Independent or Catholic schools.)
Here is a snapshot from the Children and Young People in State Care in South Australian Government Schools 2009-2019 report.
Profile of students in care
- 58.6% of all students in care were enrolled in government schools. The other 41.4% may attend in the non-government school system, or are below school-age, and a small number are non-identifiable for other reasons.
- Of the 2,223 students enrolled in government schools in 2019 –
- 1,083 were female (48.7%) and 1,140 male (51.3%)
- 1,418 were enrolled in primary school (63.8%) and 805 were enrolled in secondary school (36.2%)
- 865 were enrolled in country schools (38.9%) and 1,418 were enrolled in metropolitan schools (61.1%).
Aboriginal and Torres Strait Islander students
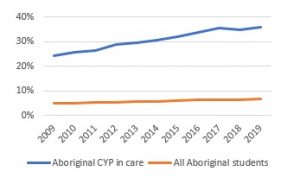
(Proportion of Aboriginal children and young people in care compared with all Aboriginal students enrolled in Department for Education schools 2009 to 2019)
- In 2019, 35.9% of children and young people in care in government schools identified as Aboriginal, compared to Aboriginal students comprising 6.6% of all government students. This reflects the vast over-representation of Aboriginal children in the care system.
- There are lower rates of school absence for Aboriginal students in care compared to the overall population of Aboriginal students attending government schools.
Students with disabilities

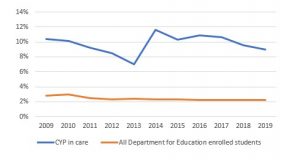
(Proportion of children and young people in care with a disability compared with all students with a disability enrolled in Department for Education schools, 2009-2019)
- A greater proportion of all children and young people in care have learning disabilities compared to the overall government school student population, notably in speech and language skills.
- The proportion of children and young people in care with an intellectual disability is over eight and a half times, and those with complex social/emotional/behavioural needs are nine times higher than the overall government school student population.
Suspensions and exclusions
(Rate of suspensions, children and young people in care compared with Department for Education school population, 2009-2019 (Term 2))
- Children and young people in care enrolled in government schools are over four times more likely to be suspended and eight times more likely to be excluded than the broader government school student cohort. But it is pleasing to see that the suspension numbers have been decreasing since 2017
Literacy and numeracy
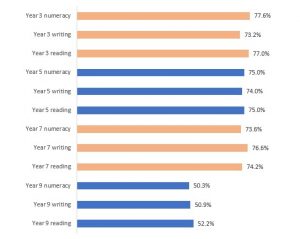
(Rate of participation in NAPLAN testing, percentage of children and young people in care (of those enrolled in Years 3, 5, 7, and 9) in Department for Education schools, 2019)
- Data consistently demonstrates that children and young people in care who are in government schools achieve poorer outcomes on average in relation to performing at or above the NAPLAN National Minimum Standard.
- There are very high NAPLAN non-participation rates for students in care in government schools. As a result we know very little about the proficiency of half of all Year 9 students and approximately one-quarter of Years 3, 5 students and 7 students in care enrolled in government schools in 2019.
- Absence, withdrawal, and exemption rates for NAPLAN testing for children and young people in care attending government schools are higher in every year level and testing category than the broader South Australian school cohort. We do not know why the withdrawal rate is so high or the reasons for the withdrawals.
Read the Guardian’s comments about this report in InDaily.

One Response
Looking at the suspension and exclusion rates I wonder if the optimism you express regarding the trend since 2017 is well founded? A concern I have is that children under guardianship may be kept at placement with the cooperation of DCP often consequent on problem behaviors. This would not register as an absence, exclusion or suspension. Nor would there be the accompanying reentry requirements. Similar practices have been observed in relation to alternative education services such as FLO. How often do DCP appeal suspensions and exclusions? I suspect this is rare, particularly when compared to parents in the community.